
Data and information as of 30 June 2018.
2018 made for a good start for the Lakehouse Global Growth Fund. The Fund deployed the bulk of its capital, navigated a volatile environment, and returned 8.5% net of fees and expenses during its abbreviated fiscal year compared to a 4.0% return for its benchmark.
It’s a good start but still only a start. Our team does not judge itself based on short-term results and neither should investors who embrace our long-term, high-conviction strategy. It’s so early, in fact, and so long is our time horizon, that the Fund is yet to sell a single share.
Taking such a long view puts the Fund on a different wavelength to the rest of the market. We do not get hung up on monthly jobs numbers, for example, or if a business with a long history of outstanding execution falls short of consensus expectations over a 3-month period.
| Companies Held: | 18 |
| Cash Allocation: | 21.4% |
| Top 5 Portfolio Holdings: | 35.5% |
| Net Asset Value per Unit: | $1.0854 |
| Fund Net Asset Value: | $81.9 million |
| Benchmark: | MSCI All Country World Index Net Total Returns (AUD) |


It’s not that macro doesn’t matter or that we give our portfolio companies a pass for poor execution, it’s just that an emphasis on the ephemeral is corrosive. For example, had investors panicked over a weak US jobs report for September 2010, which marked the fourth consecutive month of job losses after an initial post-GFC recovery, they would have done so right at the very beginning of what would prove a 7-year run of uninterrupted jobs growth.
We’re also realistic about the noise that comes with investing in aggressive growth companies. For example, traders who freaked out over one of the 18 times that Amazon missed consensus quarterly revenue estimates in the past 15 years likely left a great deal of long-term money on the table. Traders who moved in and out of Amazon over that time probably did poorly: The shares spent 31% of the past 15 years selling for more than 30% below their previous peak. And, yet, the investor who held steadfast throughout experienced a gain of almost 47-fold.
We get asked sometimes how, in our search for exceptional growth companies, we manage to stay across the vast sea of listed public companies. It’s simple: we don’t. We turn over a lot of rocks but our long-term, low-turnover approach prioritises quality over quantity when it comes to idea generation. Further, most companies aren’t worth staying across or even kicking the tyres on. A J.P. Morgan study of the Russell 3000 Index found that, between 1980 and 2014, 40% of all stocks fell 70% or more and never recovered. The same study also found that ⅔ of all individual stocks underperform their benchmarks over their lifetimes.
Instead of trying to be everywhere at once or lurching from place to place, we focus our time and energy on identifying the select few industries, ecosystems, and business models that we think have outsized potential for long-term outperformance. As an added benefit of that focus, we can also get across new prospects within our circles of competence fairly quickly and put ourselves in a better position to open the door when opportunity knocks.
We are very specific in the traits we seek in such opportunities:
• Strong positions in growing markets.
• Pricing power with customers and suppliers.
• Durable competitive advantages ground in scale, strong brands, network effects, or high customer switching costs.
• Aligned and experienced management teams with strong track records of capital allocation.
• Conservative balance sheets.
• Attractive valuations.
Few opportunities present themselves that tick most of those boxes, though, which contributes to our high-conviction approach. The Fund’s top 5 positions — Facebook, PayPal, Alphabet, Visa and Monster Beverage — make up 35.5% of its net assets. It also puts more context around why we are overweight certain industries known for their ability to scale quickly and flex pricing power (such as software) and underweight others that are capital hungry and price-taking (such as mining).
The Fund finished the year with a cash allocation of 21.4%, which is above our typical range of 5% to 15%, and stakes in 18 companies, which is outside our typical range of 20 to 40. We expect the Fund will be within typical ranges within the coming months as reporting season introduces new opportunities, however, we will remain patient stewards of the Fund’s capital.
It is not lost on us that volatility, at least in developed markets, is still on the historically low side despite a recent pick-up. Indeed, the VIX has sat at higher levels for 81% of its history. We are willing to trade away some potential upside for the comfort and ability to deploy large licks of cash at short notice when opportunities present themselves. We did just that when volatility spiked in early February, for example, and the Fund deployed more cash in the first two weeks of that month than it did in its first two months of operation.
Our team is also not oblivious to the attention that high-growth companies are receiving in markets and the media. No doubt that valuations in developed markets at-large are well above historical norms, and we’ve looked at several technology companies that appeal to us but whose price we don’t think is right today, but not every high-growth technology company should be painted with the same brush.
We are also unapologetic about our enthusiasm for owning stakes in capital-light businesses with self-reinforcing competitive advantages that operate within large, growing markets. One better, if they can and do make the most of their positions by progressively extending into adjacent markets, capturing new customers and strengthening the relationships with the ones they’ve already won. Such businesses are rare and, while we must stay patient in building our positions, our general bias is to exercise considerable patience as owners given they oftentimes make a habit of beating expectations.
Performance Review
The Fund is only about seven months old and most of its holdings were purchased within the past few months. Given that, we’d encourage investors to not read much into early position-level performance. Nonetheless, we’ll discuss it for the sake of transparency and set the tone for future letters when longer holding periods will better reflect performance.
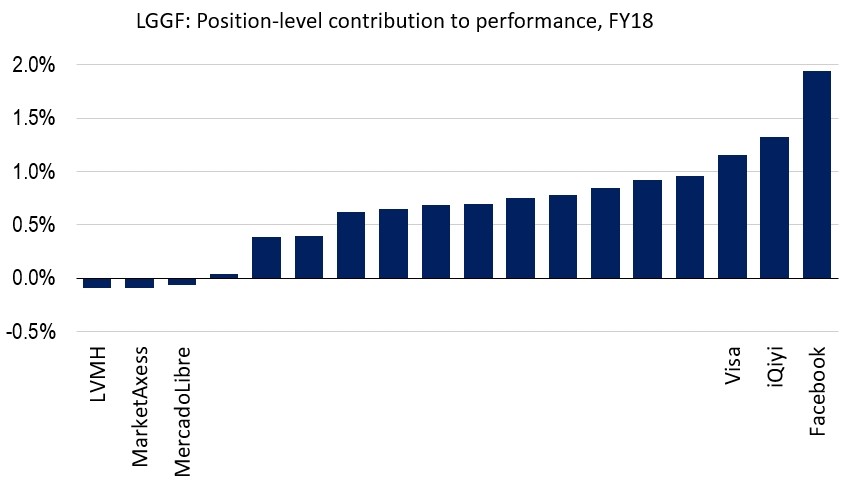
The largest contributors to Fund performance during the abbreviated fiscal 2018 were Facebook (on which the Fund’s position increased by 19.6% in local currency terms and 24.4% in Australian dollars), iQiyi (59.7% local, 62.0% AUD), and Visa (12.2% local, 18.4% AUD). We’ll discuss each in turn.
Facebook was the largest contributor to performance during the period. In a classic case of Murphy’s law, though, the shares subsequently gave back much of their recent gains when the company announced plans in late July to sacrifice some revenue and margin in order to increase quality engagement and strengthen and secure its platforms. We’ll have more to say about that in our upcoming July letter but, for now, will touch on why we remain enthused about the long-term prospects for Facebook.
The Fund went big on Facebook earlier this year as the market and media were going wild over a series of scandals that you’ve all probably heard about. For all the sound and fury, though, the number of monthly active users (MAU) on the Facebook platform increased in each of the March and June quarters and the business remains wildly profitable.
We continue to think Facebook is misunderstood despite being one of the world’s most closely watched companies — a view we can speak from experience on having long underestimated the business ourselves. For example, many investors are still comparing Facebook to MySpace even though Facebook’s MAUs are roughly 29 times the reported userbase that MySpace could boast at its cultural apex.
Facebook also has immense optionality on its eponymous platform as well as Instagram, Messenger, and WhatsApp, each of which is at different stages of monetisation and has 1-billion-plus MAUs. For example, Facebook launched a Gumtree-esque Marketplace feature in October 2016 that had more than 18 million new items posted in May alone, WhatsApp is expanding a successful payments trial in India to all users in the country, and Instagram recently rolled out both a standalone video platform and in-app payments that allow users to buy certain items without ever leaving Instagram.
The company’s US$42 billion in net cash, which makes up just over 8% of the market capitalisation, also provides considerable strategic optionality. For a sense of scope, Facebook’s net cash position is roughly equal to the combined market capitalisations of the 13 largest IT companies listed on the ASX.
The business is not bulletproof, of course, but all of the above combined with the recent pullback leaves us thinking that Facebook offers the long-term investor many more ways to win than it does to lose. And, again, more on this position next month.
iQiyi is a proposition with a far wider range of outcomes. The Chinese video platform, whose business model is something similar to YouTube meets Netflix with a splash of Disney, is the Chinese market leader for users and time spent on mobile apps, according to iResearch. The business reported an average of 421.3 million monthly average users in the last quarter of calendar 2017 and, as of the end of March, had 61.3 million paying subscribers.
The business is burning cash today as it invests in both content and customer acquisition, which makes sense given the self-reinforcing scale dynamics of the model: more users drives more data and capacity to invest in content, which drives smarter decisions around content and increased spend, which attracts more users, etc. It’s not an original playbook — Netflix has been executing a variant of this strategy for years — but early signs are that it is working. It also helps that iQiyi has plenty of headroom for growth given the company has converted less than 15% of its MAUs to paying subscribers and that another 600-plus million Chinese are still not yet internet users.
The shares have delivered a faster gain than we’d expected but we are yet to reduce as we think the business has a long runway and significant optionality. iQiyi is one of the Fund’s highest risk positions, though, and odds are good that it will produce one of the portfolio’s most binary outcomes. Given our long time horizon and relatively small investment on cost, though, we’re comfortable with what we think is a wide but positively skewed range of outcomes.
Visa, meanwhile, is a far more mature, diverse business that is wildly profitable. Visa got its start in 1958 and now has 3.3 billion cards in print, which is about 840 million more than rival MasterCard. The company takes a tiny clip of each transaction that rides its digital rails and posted an operating margin of just 67% over the year ended in March, which is extraordinary.
We think Visa still has room to run given the ongoing shift away from cash towards plastic and digital wallets at the physical point of sale, the shift from physical points of sale towards ecommerce and online shopping, and the overarching global rise of the e-consumer. Also helping is the merger with Visa Europe, which is pacing well and still has additional value to be unlocked. The shares are not an obvious bargain at around 26 times consensus calendar 2019 earnings, however, Visa and its high-margin, capital-light model have a history of quietly beating expectations. We’re happy to give such a business a good deal of rope.
The largest detractors to Fund performance among portfolio companies during the period were LVMH (on which the Fund’s position decreased by 5.5% in local currency terms and 4.0% in Australian dollars), MarketAxess (-5.7% local, -4.2% AUD), and MercadoLibre (-4.8% local, -3.3% AUD).
Practically speaking, nothing of fundamental note has occurred since the Fund opened stakes in these businesses in May. Further, none of these positions are among the Fund’s top 10 holdings and, on a combined basis, they have chipped off less than 0.3% of performance. Given the lack of materiality and the lack of new news, we’ll simply note that we remain long all 3 positions, each of which we discussed in the May investor letter.
Thank you
Thank you for coming on this journey with us. Our team is honoured to serve you and we are having a lot of fun along the way. Markets will not always stay as buoyant as they are today but, by sticking to our process and maintaining a longer-term view than our peers, we feel good about our chances of delivering on the Fund’s objective of long-term outperformance.
Best Regards,

Joe Magyer, CFA
Chief Investment Officer
The Lakehouse Global Growth Fund is now accepting new investors
The Lakehouse Global Growth Fund focuses on investing in mid- to large-capitalisation global growth companies in developed markets. We’re excited to back some of the world’s great growth companies, diversify into new markets, and do it with our signature high-conviction, low-turnover style. Big picture, we’re backing market leaders with long growth runways.
Investing in the Fund is a big decision for investors and it’s important to make an informed choice. Potential investors should read and consider the Product Disclosure Statement (and seek professional advice) when deciding whether to acquire units in the Lakehouse Global Growth Fund. And while the PDS is the definitive guide, we’d welcome any follow-up questions potential investors may have about the Fund and its strategy. We can be contacted at [email protected] or 02 8294 9800.
What should potential investors expect in the application process?
In advance of filling out the direct application form, (and especially if applying in the name of a SMSF/ Company/ Trust etc) we strongly encourage potential investors to watch this brief 3-minute instructional video:
Potential investors, to access the Lakehouse Global Growth Fund application form, please click the button below:
Lakehouse Global Growth Fund (ARSN 621 899 367) (Fund). The responsible entity for the Fund is One Managed Investment Funds Limited (ACN 117 400 987) (AFSL 297042). The Fund is offered in Australia and New Zealand. The information included in this message has been prepared without taking account of the reader’s objectives, financial situation or needs. All of the commentary, statements of opinion and recommendations contain only general advice. Any person reading this message should, before deciding to invest in the planned Fund, read the product disclosure statement and seek professional advice.
Sole use and confidentiality: This report has been prepared by Lakehouse Capital Pty Limited (ABN 30 614 957 603, authorised representative of AFSL 400691) and by its officers, employees and agents (collectively “Lakehouse”) for the sole use of its clients as a record of the performance of their investment. The contents of this report are confidential, and the client may only disclose such contents to its officers, employees or advisers on a need to know basis, or with the prior written consent of Lakehouse.
Disclaimer: The responsible entity for the Lakehouse Global Growth Fund (ARSN 621 899 367) is One Managed Investment Funds Limited (ACN 117 400 987) (AFSL 297042) (“OMIFL”). The information contained in this document was not prepared by OMIFL but prepared by other parties. All of the commentary, statements of opinion and recommendations contain only general advice and have not taken into account your personal circumstances. This report contains general financial product advice only. Any investment in Lakehouse or OMIFL products need to be made in accordance with and after reading the Product Disclosure Statement and Additional Information Booklet dated 11 December 2017. The opinions, advice, recommendations and other information contained in this report, whether express or implied, are published or made by Lakehouse in good faith in relation to the facts known at the time of preparation. Information is current as at the date of the letter, unless otherwise noted. Past performance is not indicative of future performance.
Limitation of liability: Whilst all care has been taken in preparation of this report, to the maximum extent permitted by law, neither Lakehouse or OMIFL will be liable in any way for any loss or damage suffered by you through use or reliance on this information. Lakehouse and OMIFL’s liability for negligence, breach of contract or contravention of any law, which cannot be lawfully excluded, is limited, at Lakehouse’s option and to the maximum extent permitted by law, to resupplying this information or any part of it to you, or to paying for the resupply of this information or any part of it to you.
Disclosure: Lakehouse, its directors, employees and affiliates, may, and likely do, hold units in the Lakehouse Global Growth Fund and securities in entities that are the subject of this report. Copyright: Lakehouse owns the copyright to this publication. Its contents may be used for your own personal use, but you must not (without Lakehouse’s consent) alter, reproduce or distribute any part of this publication, transmit it to any other person or incorporate the information into any other document.
Figures accurate as at 30 June, 2018. Lakehouse Global Growth Fund PDS | Lakehouse Global Growth Fund AIB